Role
Product Designer
Product Designer
Duration
2.5+ Years
2.5+ Years
Tools
Figma, Illustrator, After Effects, Miro
Figma, Illustrator, After Effects, Miro
Team
My11Circle Product Team
My11Circle Product Team
Product Designer / Sr. Product Designer
My11Circle Product Design Team
My11Circle Product Design Team
2023-2025
2023-2025
During my time as a Product Designer for My11Circle at Games24x7, I had the opportunity to shape the core product across a wide range of initiatives. My role centered on elevating the platform's design language, building cohesive visual systems, and driving creative ideation to bring fresh, innovative experiences to our users.
During my time as a Product Designer for My11Circle at Games24x7, I had the opportunity to shape the core product across a wide range of initiatives. My role centered on elevating the platform's design language, building cohesive visual systems, and driving creative ideation to bring fresh, innovative experiences to our users.
Collaborating with an exceptional team and learning from experienced mentors was a major highlight of my time at My11Circle. Together, we successfully achieved our core objective: elevating the app experience to a top-tier standard. This journey was incredibly pivotal to my own professional growth, accelerating my skills and ultimately leading to my promotion to Senior Product Designer.
Collaborating with an exceptional team and learning from experienced mentors was a major highlight of my time at My11Circle. Together, we successfully achieved our core objective: elevating the app experience to a top-tier standard. This journey was incredibly pivotal to my own professional growth, accelerating my skills and ultimately leading to my promotion to Senior Product Designer.


Compare/Analysis Teams
& Winner's Reaction
"Driving a 40% engagement lift and 2.5% revenue growth by building a real-time player comparison/Analysis experience for 20 million daily active users"
Background
Games24x7 is India’s premier gaming company, boasting a player base of over 100 million across flagship platforms like RummyCircle, My11Circle, and PokerCircle.
As its standout fantasy sports platform, My11Circle has driven massive growth reaching 20 lakh daily active users and around ₹600 Crores in revenue for FY24-25, while also serving as an official sponsor for IPL 2024 and 2025.
My Role / Impact
Senior Product Designer
As the sole product designer, I led the 0-1 design, including Research, Compitetor Analysis, Design iterations, Prototyping to the final reslease.
Research, Analysis, conceptualisation, Visual design, Motion graphics, Interactions, Prototyping, Testing
Objective
Enable users to check their relative performance seamlessly with respect to other players and top team
Duration
Oct 24 - Jan 25
Project overview
During a live match, a user is usually checking their team performance. MEC game in itself being a competitive one where the relative performance matters a lot, it becomes crucial to track other players performance and at the same time check where is user’s team wrt other user to find out the chances of getting ahead and winning.
Team
1 Designer (me)
1 Product Manager
2 Engineers
Tools used
Figma, Illustrator, After effects, Miro
Results
2.5% overall Revenue Jump
40% Engagement Boost
3.8 times per user, per match interaction
Team comparison will enable users to check their standing wrt other teams and hence enhanced engagement
Player stats page will now be highlighting a team , visits to player stats will go up and users will be checking the highlighted team’s performance
Team comparison will enable users to check their standing wrt other teams and hence enhanced engagement
Player stats page will now be highlighting a team , visits to player stats will go up and users will be checking the highlighted team’s performance

Relative performance checks are missing and users are manually opening the ultimate team and checking their relative standing. Around 30% of joined match users check the ultimate team with a frequency of almost 3.7 times per match. Additionally, 39% of distinct users open the player stats page with a frequency of 3.6 times per match to check their team’s standing.
Relative performance checks are missing and users are manually opening the ultimate team and checking their relative standing. Around 30% of joined match users check the ultimate team with a frequency of almost 3.7 times per match. Additionally, 39% of distinct users open the player stats page with a frequency of 3.6 times per match to check their team’s standing.

Understanding Problem
Understanding Problem
Poor Live
Tracking
Poor Live
Tracking
There was no clear, intuitive way for users to track their team's live metrics at once.
The Engagement
"Dead Zone"
The Engagement
"Dead Zone"
Once a match started, the core user journey essentially paused, giving users very little reason to actively interact with the app.
Tedious Manual
Comparisons
Tedious Manual
Comparisons
Users were forced to manually dig through leaderboards to check their competitors' scores, resulting in unnecessary cognitive load.

Business Goals
Business Goals
Compare teams uptake ~ 30% with
a frequency of 3.6 times per match
Compare teams uptake ~ 30% with
a frequency of 3.6 times per match
In app time spent by
the user + 4.3%
In app time spent by
the user + 4.3%
PM
Authored the PRD, which we collaboratively refined to align business and user goals.
Authored the PRD, which we collaboratively refined to align business and user goals.
Designer
Led research, competitive analysis, UI iteration, prototyping, internal testing, and final visual/motion design.
Led research, competitive analysis, UI iteration, prototyping, internal testing, and final visual/motion design.
Engineer
Handled development, supported by my seamless handoff of organized assets, components, and optimized, tech-friendly animation files.
Handled development, supported by my seamless handoff of organized assets, components, and optimized, tech-friendly animation files.
Product Requirements Gathering
Product Requirements Gathering
Contextual Research & Strategy
Contextual Research & Strategy
Iterative Process
Iterative Process
High-Fidelity UI Finalization
High-Fidelity UI Finalization
Seamless Motion Design
Seamless Motion Design
Cross-Functional Handoff
Cross-Functional Handoff
Implementation
QA
Implementation
QA
User Acceptance Testing (UAT)
User Acceptance Testing (UAT)
Deployment & Monitoring
Deployment & Monitoring

Crafting an experience that is intuitive, beautiful, and engaging to help people succeed in tracking performance
Crafting an experience that is intuitive, beautiful, and engaging to help people succeed in tracking performance
In My11Circle, the core user journey involves creating a fantasy team and joining a contest. However, once the live match begins, active gameplay halts. Users are left in a "watch and wait" state, frequently opening the app just to monitor live team performance and fluctuating leaderboard rankings.
The goal of this feature is to streamline that post-match-start experience by consolidating all real-time updates and rankings into a single, comprehensive live-tracking dashboard.

Analysis Teams Page
Analysis Teams Page

Profile area
This section displays the player's name, picture, their team number, and the current over of the match. If a user has created multiple teams, they can easily switch between them here. The area dynamically updates to show either the user's own team details or a competitor's details, depending on whose profile is currently being viewed. In others profile option follow and add to your network will be there.
Win-O-Meter
This predictive tool calculates the player's probability of winning or finishing in the top ranks. The data is visually represented by a clear percentage alongside a dynamic, filling progress bar.
Social Leaderboard
A localized ranking view that filters the competition, displaying the user's standing exclusively among their in-app friends participating in the same match.

Current rank tracker
This section displays the selected player's real-time leaderboard position alongside their projected prize winnings based on that current rank. To elevate the experience and drive engagement, the UI incorporates dynamic micro-animations. These subtle motion elements provide positive visual reinforcement to keep the user motivated.
AI Prediction Engine
This feature leverages predictive algorithms to forecast the user's performance for the current match. By analyzing a complex dataset, including the user's historical scores, current roster choices, and past player performance metrics, the AI generates a seamless, real-time forecast. It provides users with a highly probable leaderboard ranking range and their corresponding projected prize winnings.
Ultimate Team comparison
The "Ultimate Team" is a dynamically updating, mathematically perfect lineup consisting of the match's highest-scoring players, including the ideal Captain and Vice-Captain. This section benchmarks the selected player's current points directly against the maximum possible points generated by this ideal team.
Match insights
Provides real-time updates on critical match events that impact the user's rank, highlighting top-performing players and tracking how many "Ultimate Team" players are currently in the user's lineup.

Glen Maxwell
80% teams didn’t pick the ultimate player Glen Maxwell

Dimuth and Mitchell both became the star of this match scoring more than 100 Pts
07
/11
Your 7 out of 11 players picked are Ultimate players today.
Live Prize Projections
This feature leverages real-time match data to forecast potential winnings based on the user’s active lineup. It goes a step further by outlining the specific conditions required to reach higher prize tiers. By displaying dynamic scenarios, such as the exact points needed from yet-to-play roster members or the required performance boost from currently active players, it keeps users highly engaged with the live match.
You win ₹2.5 Lakhs.. if
₹2.5 Lakh +



Virat Kohli Scores 20 runs
+22 Pts
Dushan takes a wicket

+32 Pts
Glen Maxwell takes a wicket
+42 Pts

David warner scores 28 runs
+22 Pts
Terms and Conditions
Contains standard terms and conditions, alongside transparency clauses that clearly outline the limitations, accuracy expectations, and non-guaranteed nature of the AI-driven forecasts.
Terms & Conditions
Current winnings are not guaranteed to remain the same and may change, as they are subject to game dynamics
Win-o-meter estimates the probability of winning with the help of AI model that uses historical information. While this prediction provides insight, it may not always be accurate.
We are not liable for any inaccuracies produced by AI. The information provided is merely a prediction of what may or may not occur.
Ultimate team is the best possible team, with the top 11 fantasy players (most fantasy points). This might change as the match progresses.
Team performance Preview
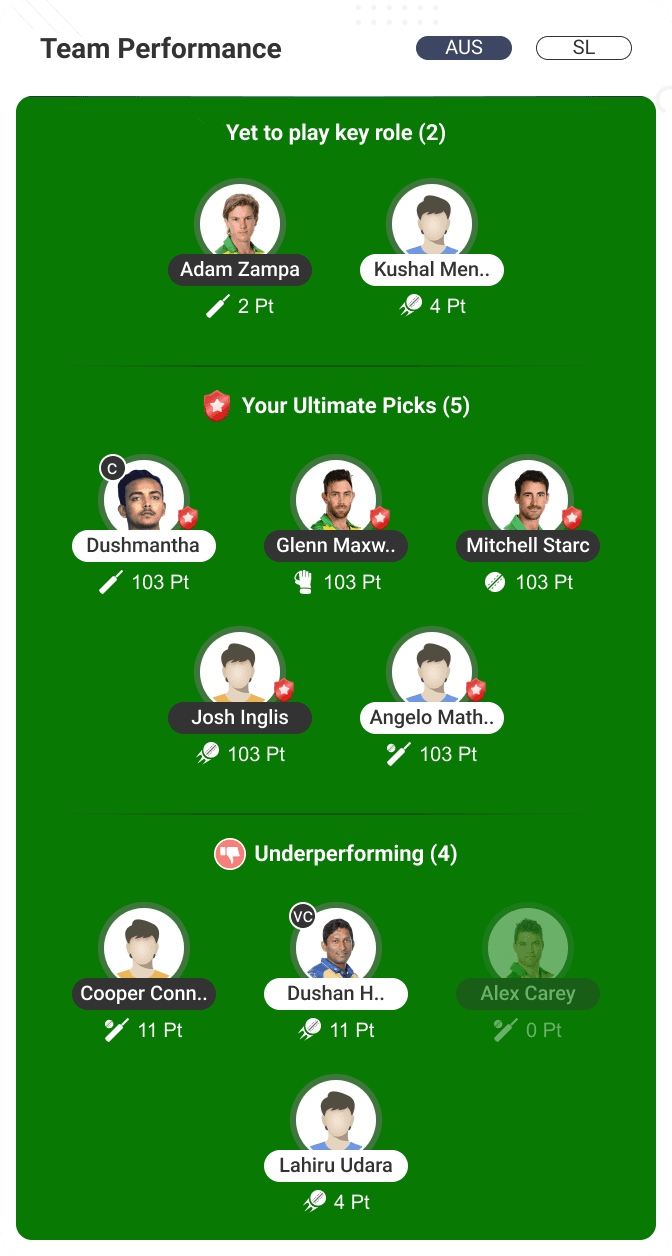
A comprehensive roster view displaying player roles, Captain/Vice-Captain selections, and real-time scores. It includes status indicators to show which players are yet to play, have finished, or are actively overperforming or underperforming.
Post-Match Analysis
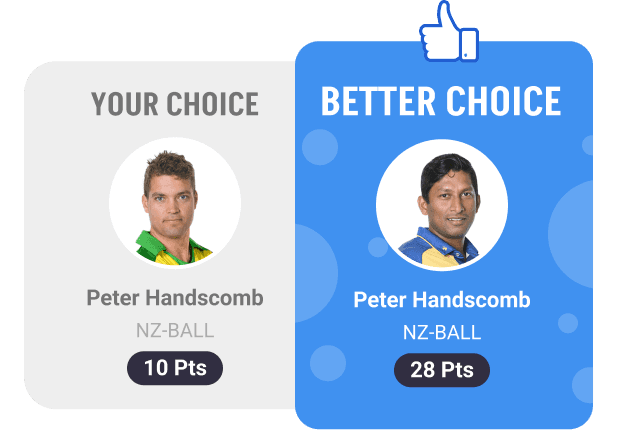
This section appears once the match concludes and final rankings are locked. It displays the user's actual winnings alongside a "what-if" scenario, revealing the potential prize they could have secured with optimal roster adjustments. By highlighting specific missed opportunities, such as selecting a higher-performing Captain, Vice-Captain, or swapping underperforming players, it clearly shows the exact point differential required to have achieved a higher leaderboard tier.
You Won
₹50,000
+100 pts
Could’ve Won
₹2.5 Lakh +
Better choice of Captain
+42 Pts
Better choice of Player
+35 Pts
Better choice of Player
+18 Pts


Compare Teams Page
Compare Teams Page
Compare Section
This section/toggle provides a granular, side-by-side breakdown of both users' drafted rosters. It systematically categorizes the lineups into common selections and unique, differential picks. The module highlights critical variations in Captain and Vice-Captain choices, player roles, and positional distribution. Individual point differentials are tracked in real-time, utilizing intuitive green and red color-coding to instantly indicate whether the user's specific pick is outperforming or trailing the competitor's.
Comparison
Analysis

Terms and Conditions
Contains standard terms and conditions, alongside transparency clauses that clearly outline the results are only for representation and not be the final.
Terms & Conditions
Current winnings are not guaranteed to remain the same and may change, as they are subject to game dynamics
Win-o-meter estimates the probability of winning with the help of AI model that uses historical information. While this prediction provides insight, it may not always be accurate.
We are not liable for any inaccuracies produced by AI. The information provided is merely a prediction of what may or may not occur.
Ultimate team is the best possible team, with the top 11 fantasy players (most fantasy points). This might change as the match progresses.

Comparison
Analysis
Comparison
Analysis
Analysis Section
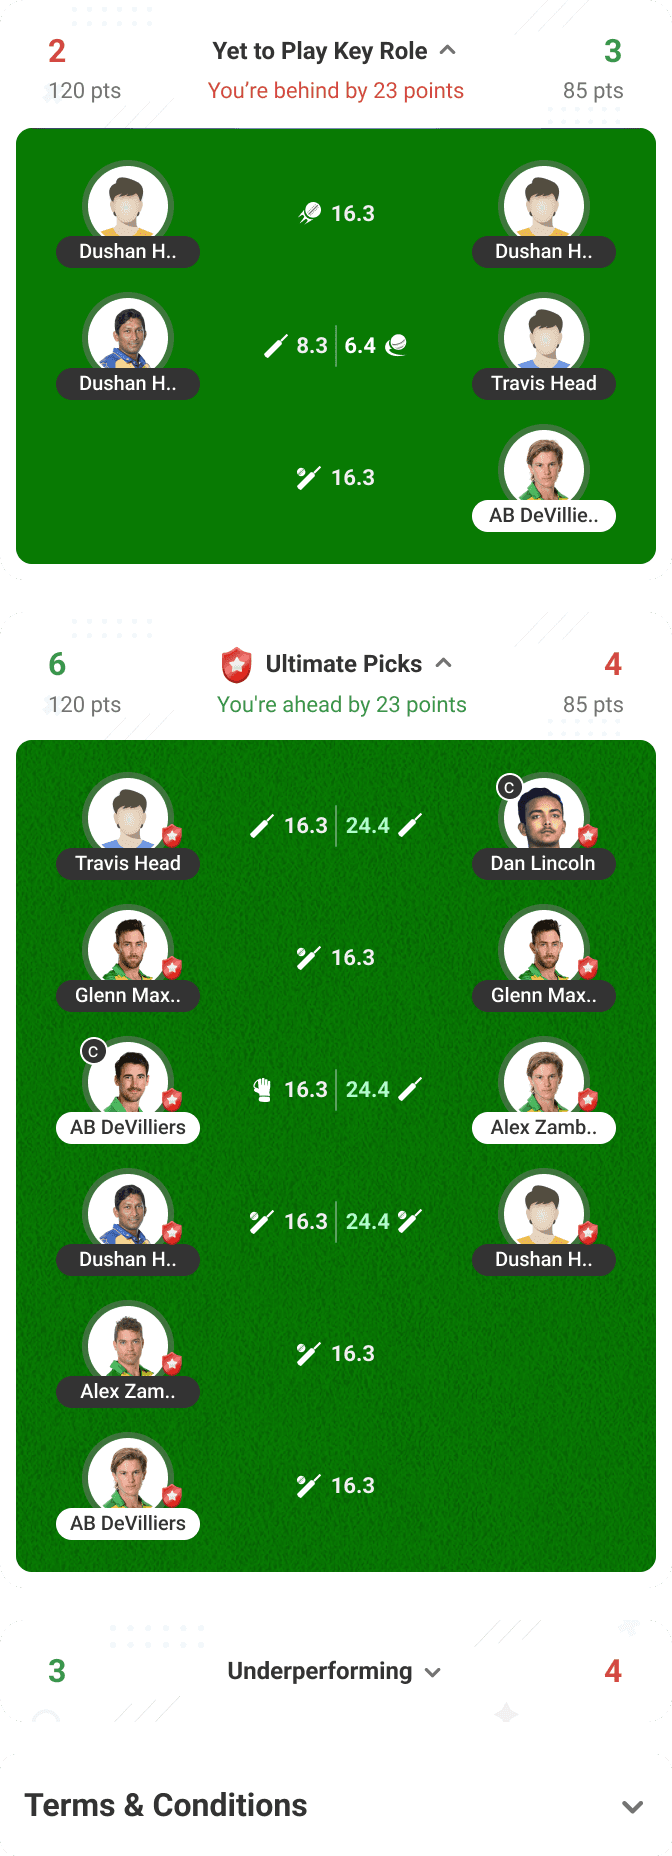
This section/Toggle provides a deep-dive performance analysis of the two competing lineups. It categorizes players based on their current match status, clearly highlighting those who have yet to play, are actively over-performing, or are underperforming. The module breaks down aggregate player counts, roles, individual scores, and sectional point differentials. Utilizing intuitive green (leading) and red (trailing) color-coding, users can instantly assess their advantage in each category. Additionally, it cross-references mathematically with "Ultimate Team."
Comparison
Analysis
Head-to-Head Comparison
This section facilitates a direct performance analysis between the user's active lineup and a selected competitor. It displays core identifiers such as names, avatars, and team numbers, alongside the current match over for real-time context. A built-in team switcher allows users with multiple lineups to seamlessly toggle their view. The module dynamically compares live metrics, including current rank, total points, and win probability, utilising intuitive color-coded indicators (green for leading, red for trailing) to instantly visualise the point differential.





Initiation points for Compare and Analysis process
Initiation points for Compare and Analysis process
Compare Teams Page
Compare Teams Page
Analysis Teams Page
Analysis Teams Page
Initiating the Comparison Flow
Initiating the Comparison Flow
To access the head-to-head mode, users navigate to the live match leaderboard and tap the "Compare" action. By default, the user's active team is pre-selected, prompting them to choose one opponent for a direct comparison. For broader analysis, users also have the flexibility to deselect their own lineup and select two entirely separate competitors to compare against each other.
To access the head-to-head mode, users navigate to the live match leaderboard and tap the "Compare" action. By default, the user's active team is pre-selected, prompting them to choose one opponent for a direct comparison. For broader analysis, users also have the flexibility to deselect their own lineup and select two entirely separate competitors to compare against each other.
Switching Teams
Switching Teams
A frictionless toggle that allows users to instantly swap their selected lineup within the active comparison view, updating live data without ever breaking the user flow or leaving the page.
A frictionless toggle that allows users to instantly swap their selected lineup within the active comparison view, updating live data without ever breaking the user flow or leaving the page.
Winner's
Winner's
Reaction
Reaction

Winner's Reaction is a feature that allows Winners to share their winning moments. By highlighting genuine user success stories, this feature serves as powerful social proof.
Winner's Reaction is a feature that allows Winners to share their winning moments. By highlighting genuine user success stories, this feature serves as powerful social proof.
It builds essential trust within the community by proving that real people, not bots are winning actual rewards. This transparency boosts the morale of other players, motivating them to enter new contests, which ultimately drives user engagement and increases platform revenue.
It builds essential trust within the community by proving that real people, not bots are winning actual rewards. This transparency boosts the morale of other players, motivating them to enter new contests, which ultimately drives user engagement and increases platform revenue.
Onboarding Animation
Onboarding Animation
A brief onboarding animation designed to educate winners on how to upload a photo/video as a reaction, ending with a direct CTA to seamlessly launch the camera.
A brief onboarding animation designed to educate winners on how to upload a photo/video as a reaction, ending with a direct CTA to seamlessly launch the camera.
Upload Process
Upload Process
The flow begins with a clear Upload now, prompting the user to upload their reaction. Tapping this seamlessly launches the device's native camera, offering intuitive controls to switch between photo and video modes, as well as front and rear camera lenses. After capturing the moment, users enter a review state where they can either retake or confirm their media. Upon confirmation, the system displays real-time feedback via a percentage progress loader. The flow concludes with a celebratory success screen, after which the reaction immediately goes live for the community to view on both the Winners' Leaderboard and the dedicated Winners' Page.
The flow begins with a clear Upload now, prompting the user to upload their reaction. Tapping this seamlessly launches the device's native camera, offering intuitive controls to switch between photo and video modes, as well as front and rear camera lenses. After capturing the moment, users enter a review state where they can either retake or confirm their media. Upon confirmation, the system displays real-time feedback via a percentage progress loader. The flow concludes with a celebratory success screen, after which the reaction immediately goes live for the community to view on both the Winners' Leaderboard and the dedicated Winners' Page.
Story-Style Viewing Experience
Story-Style Viewing Experience
A sequential, story-style viewing interface that allows users to seamlessly watch multiple winners' reactions back-to-back. It includes an integrated follow/unfollow button to help users easily curate their personal social network.
A sequential, story-style viewing interface that allows users to seamlessly watch multiple winners' reactions back-to-back. It includes an integrated follow/unfollow button to help users easily curate their personal social network.


Conclusion
+2.5%
Overall
Revenue Jump
Old Users
+2.4%
New Users
+4.3%
+40%
Engagement
Boost
Time Spent in live
match per session
3.8 times per match
Building user
Trust
Seeing real winners
play builds trust
Increased network visibility leads to increased gameplay
Winner's Reaction
Winner's Reaction
Growth in Games per day
+1.5%
Overall Revenue Jump (D10)
+2%
Higher day on day following at a distinct user level
~2x
Visit to winner’s page (day on day)
+61%
More visibility of network with improved follow activity
+30%
Analysis & Win-O-Meter
Analysis & Win-O-Meter
Growth in Player Days
+1.42%
Overall Revenue Jump (D10)
+0.5%
Analysis Uptake : Day on Day Visits
~40%
Analysis Uptake : Times per match
3.8 times
Analysis Uptake : feature retention (D10)
~50%
Great details need a bigger canvas.
This portfolio features in-depth case studies and intricate UI mockups that are best experienced on a larger screen. For the optimal viewing experience, please open this link on your desktop or laptop.